Overview
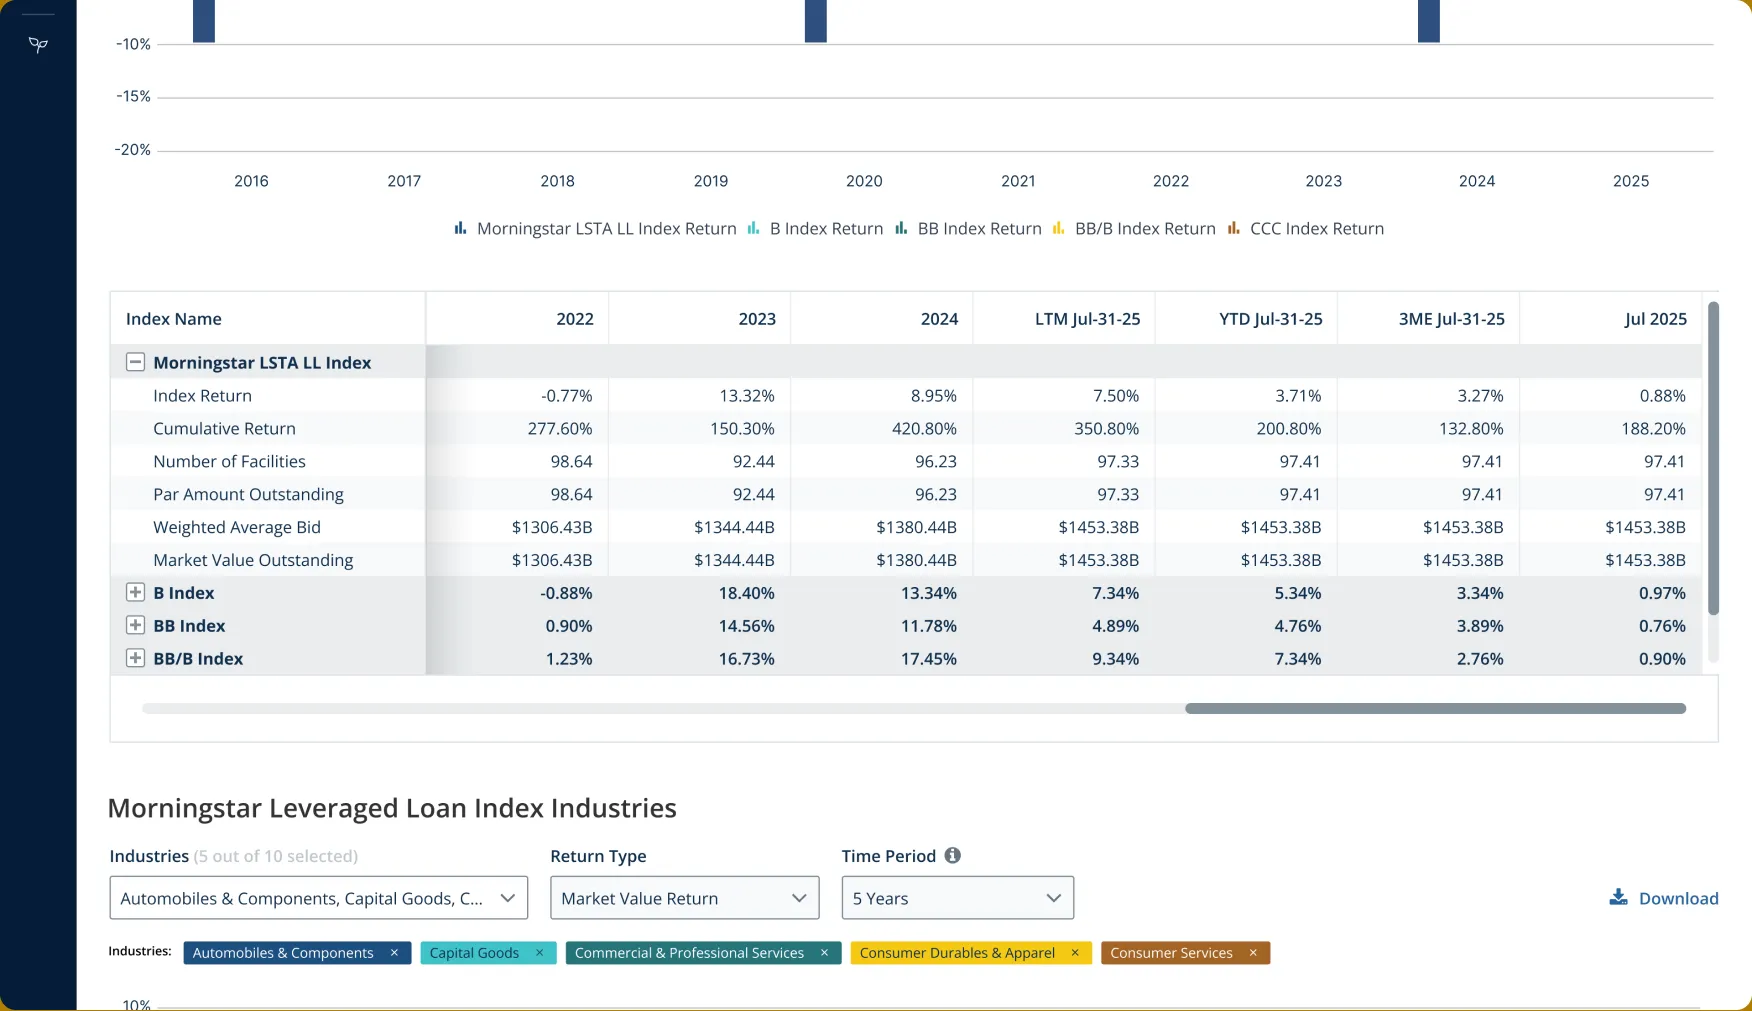
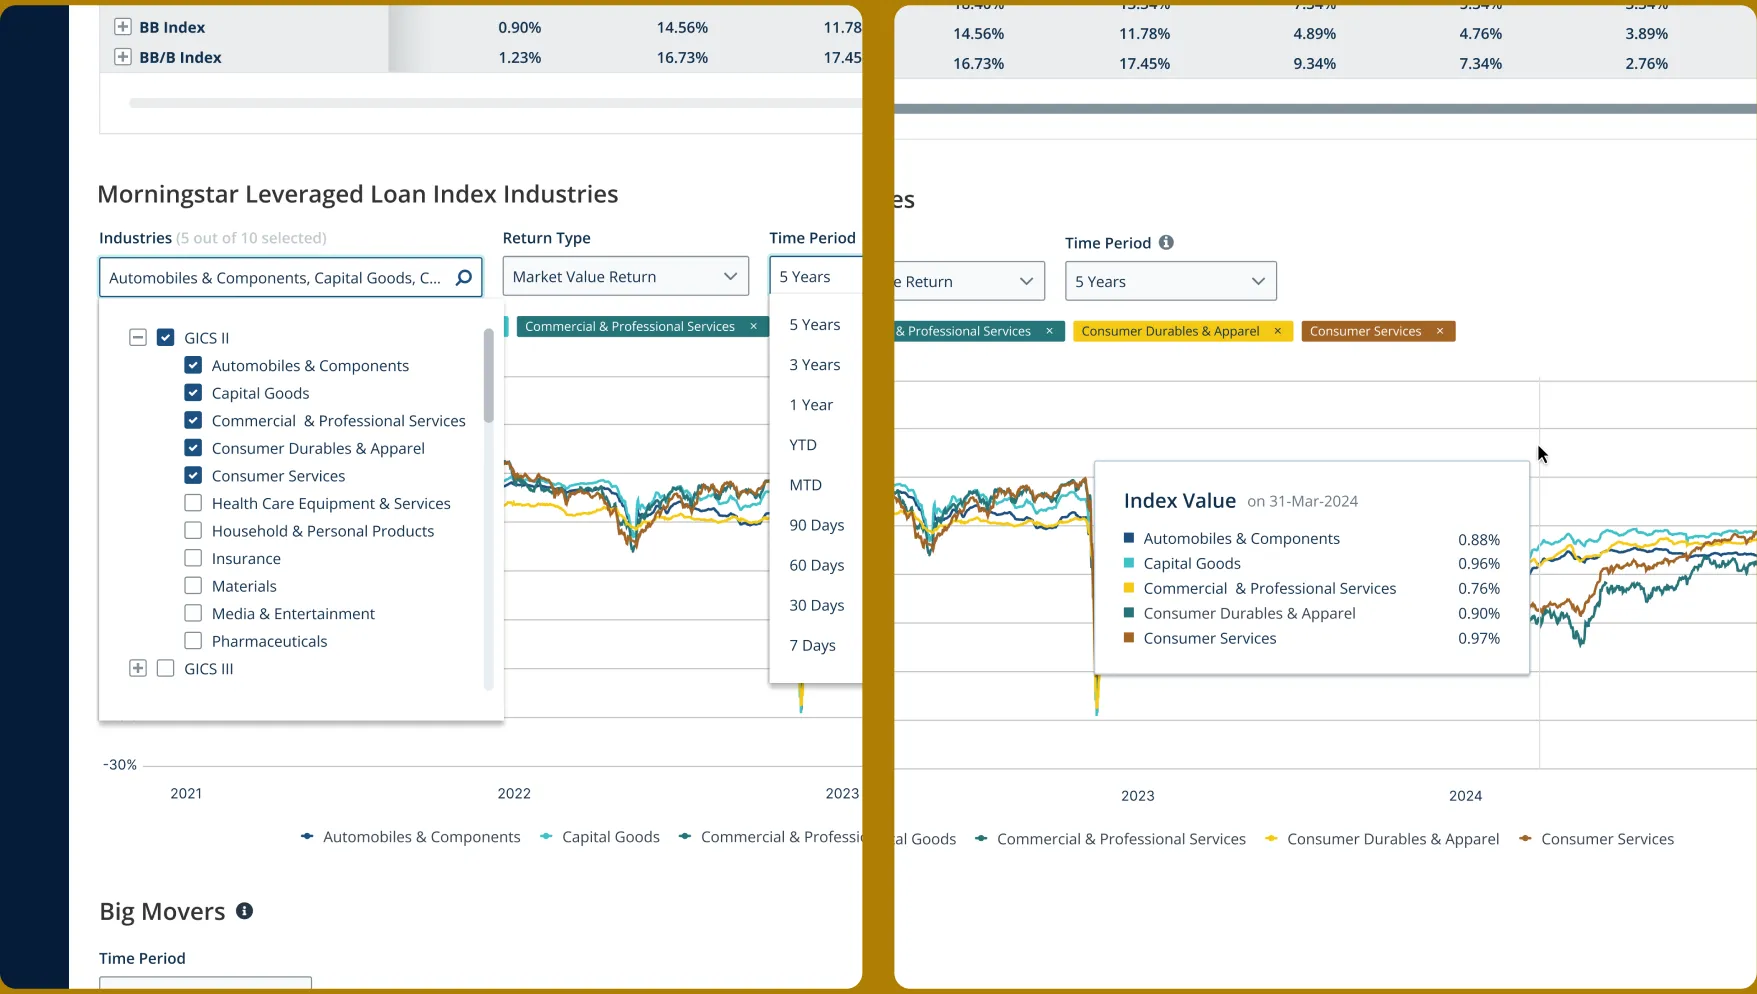
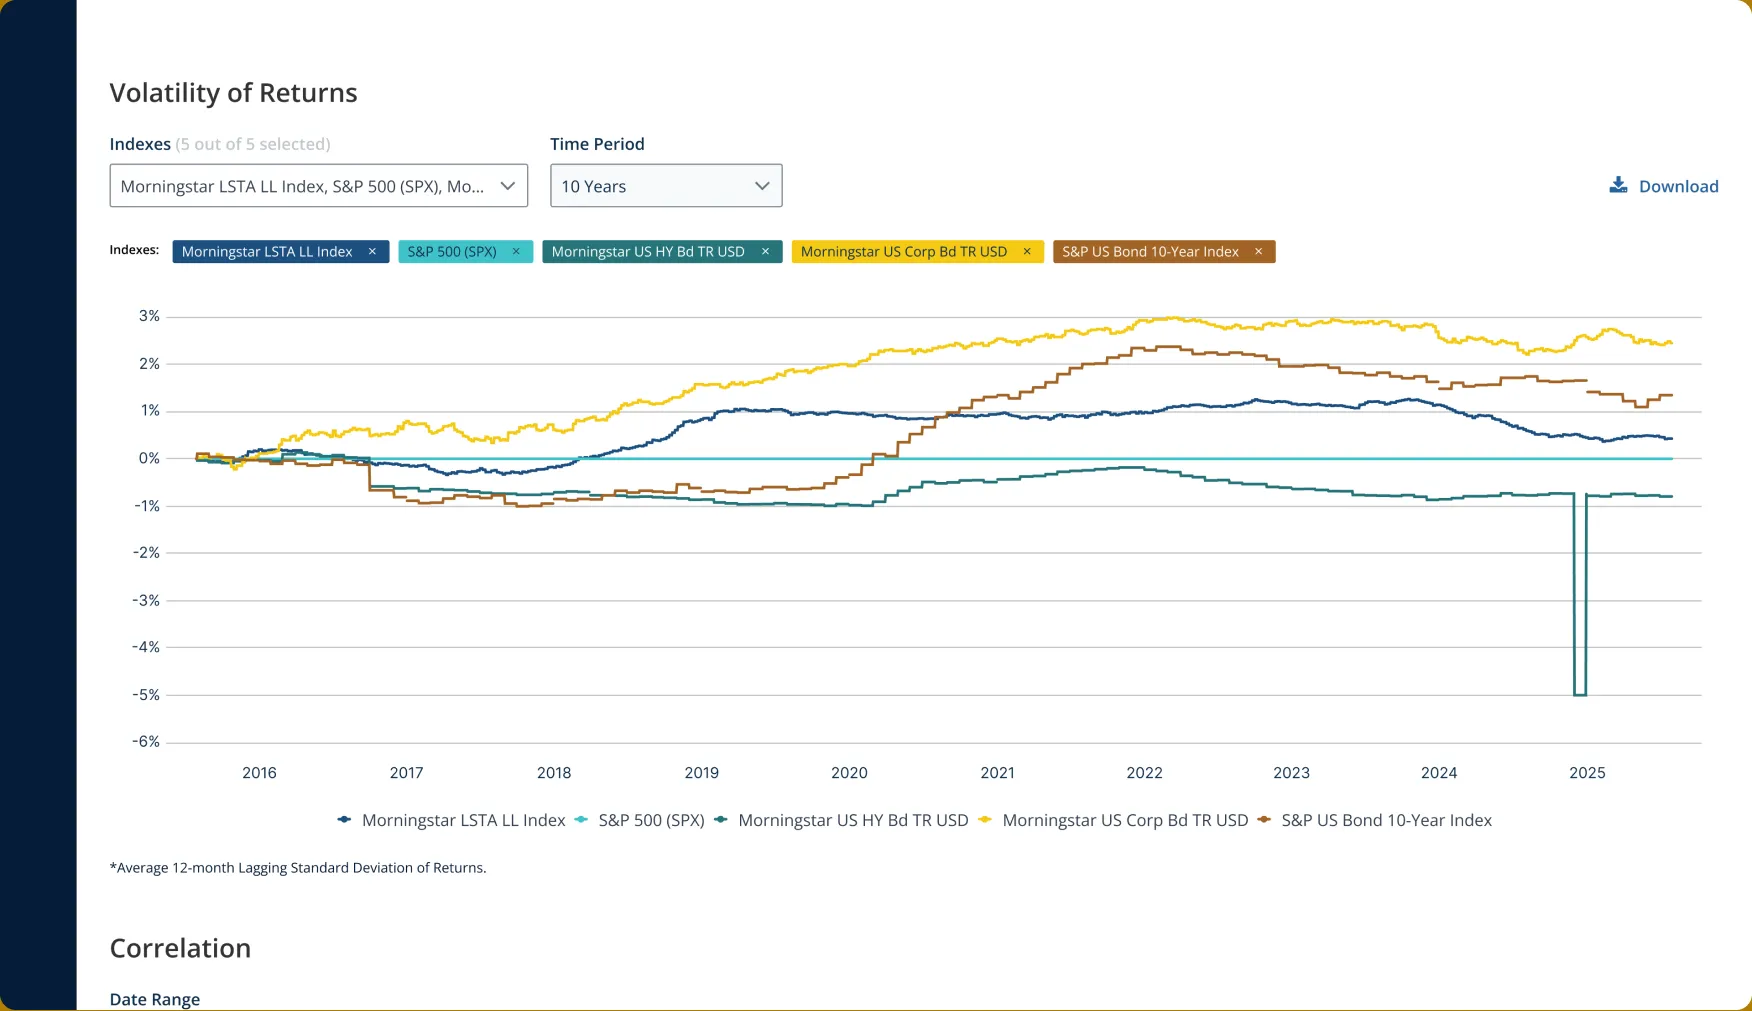
Transforming excel sheet to an interactive dashboard for accessing, visualizing, and analyzing 80K+ Leveraged Loan indices.
PitchBook is a financial data and research platform that provides information on private and public companies, investors, deals (like venture capital, private equity, and M&A), and market trends.
Impact
4 hrs
Saves per analyst for each research session.
25%
of support calls about Leveraged Loan Indexes reduced.
- Contribution
- User research, product design, prototyping.
- Collaboration
- Design lead (1), product manager (1), solutions (3), data analyst (1).
- Tools
- Figma, Zoom, Lucidchart.
- Client
- PitchBook Data
- Notes
- This is a limited case study. Please contact me for more details.
Business problem
Keeping users in platform.
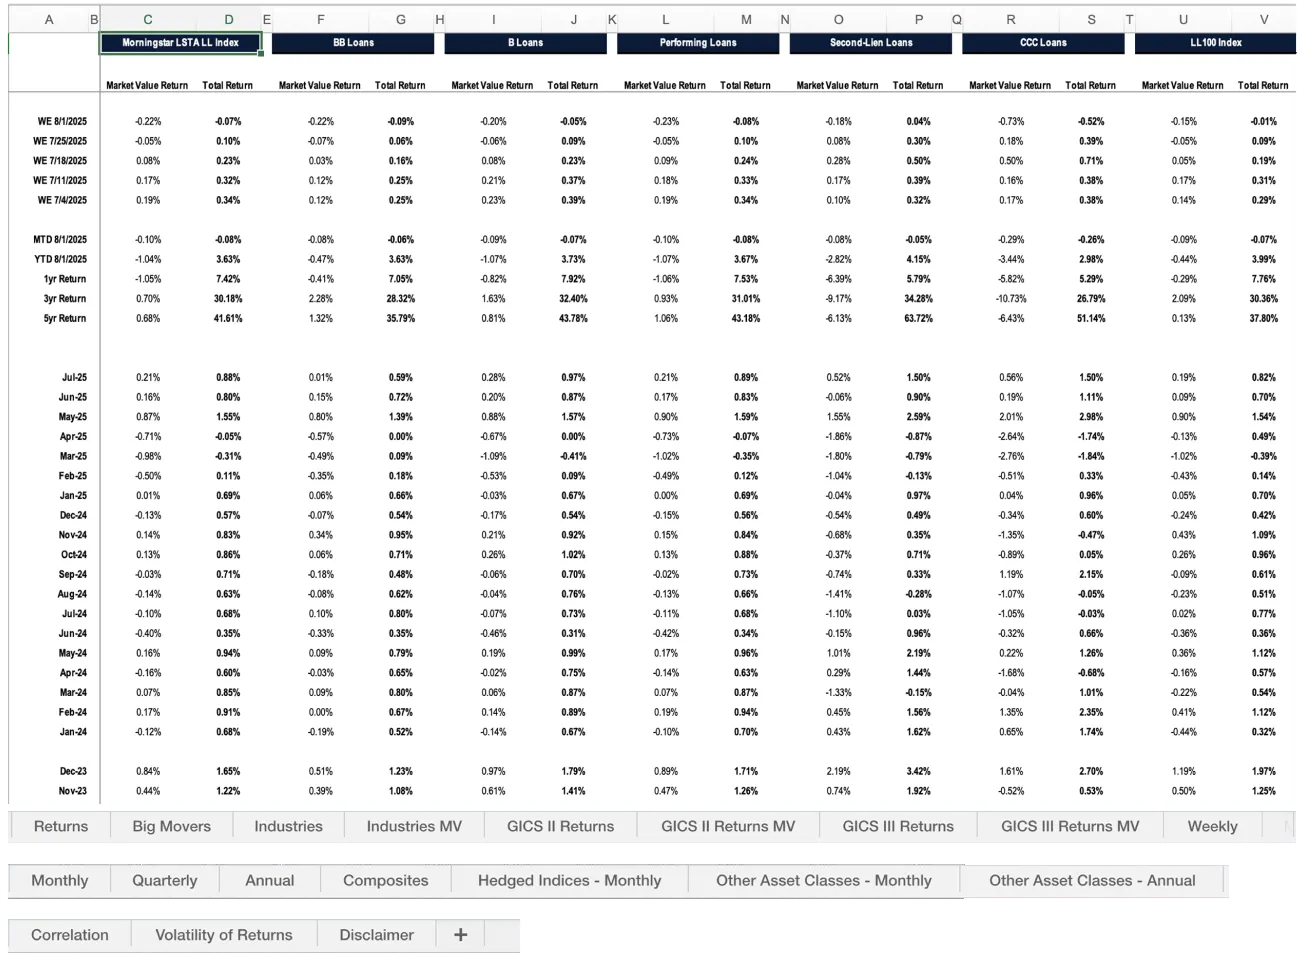
With the acquisition of Leveraged Commentary Data (LCD), PitchBook brought in a plethora of Leveraged Loan indices to their platform. However, this access was only available through two main methods: APIs and direct Excel downloads. Because Excel files are static, they saw a demand to integrate these key reports into their platform as a market analysis tool.
User problem
Retrieving scattered data from multiple tabs.
Manual effort to download and break out data.
With 18 tabs and 80+K data points, getting specifics of a few loans that they worked on was a challenge. Plus, every week, they had to download, extract and break out the data just to see the value of the updated index they were working on.
Lack of visual representation for quick scanning.
Due to static file structure of the excel files and the large number of data on each tab, seeing the trends required additional steps. This elongated users access to meaningful data and slowed their benchmarking processes.
Process
Information architecture exploration.
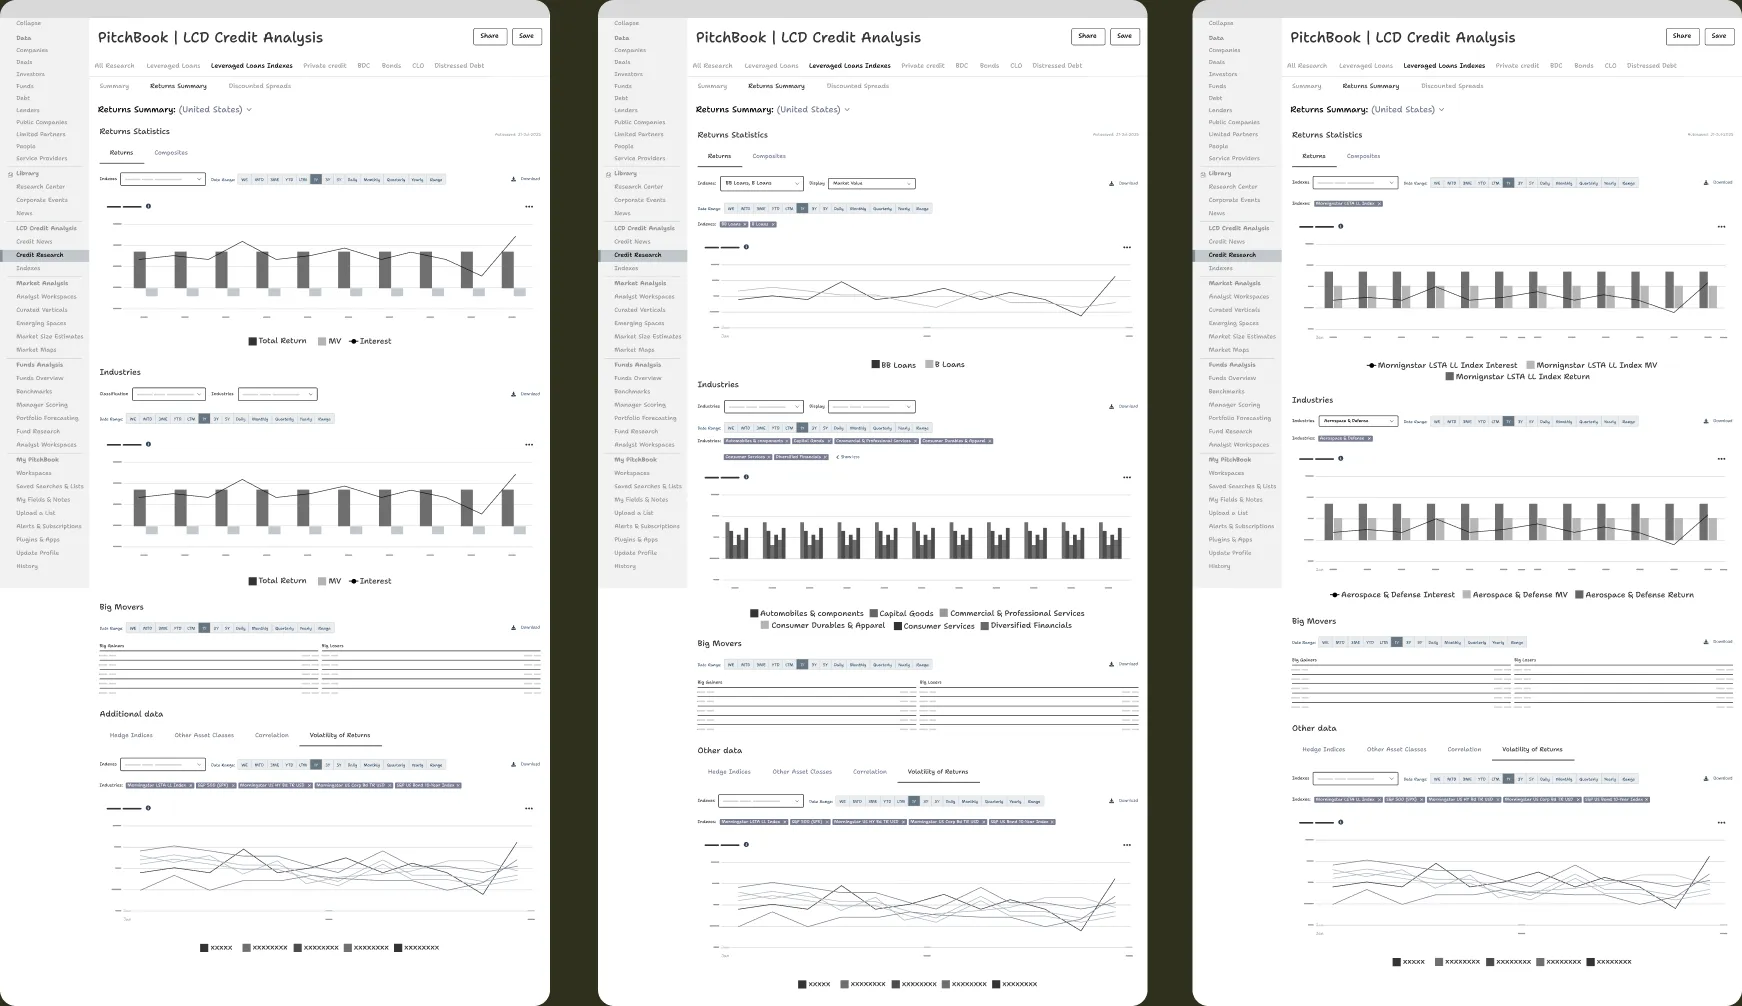
Started by grouping and consolidating relevant data points. Then organized based on the most to the least used tabs and iterated further based on more user feedback.
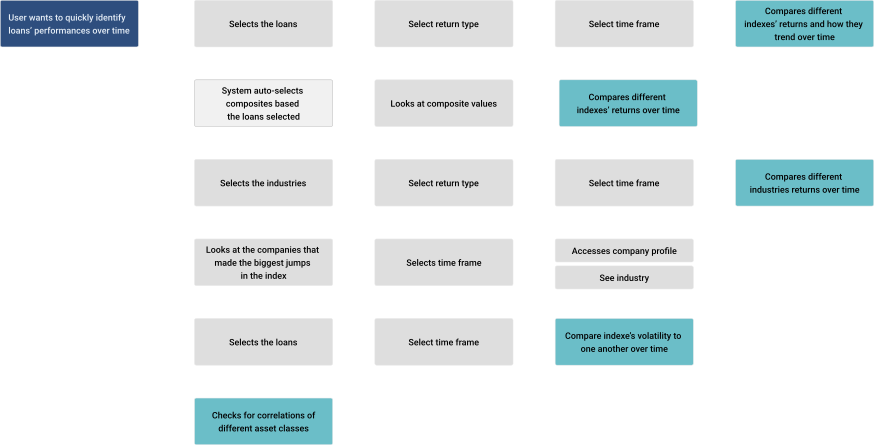
Used lo-fi iterations to get buy-in from stakeholders.
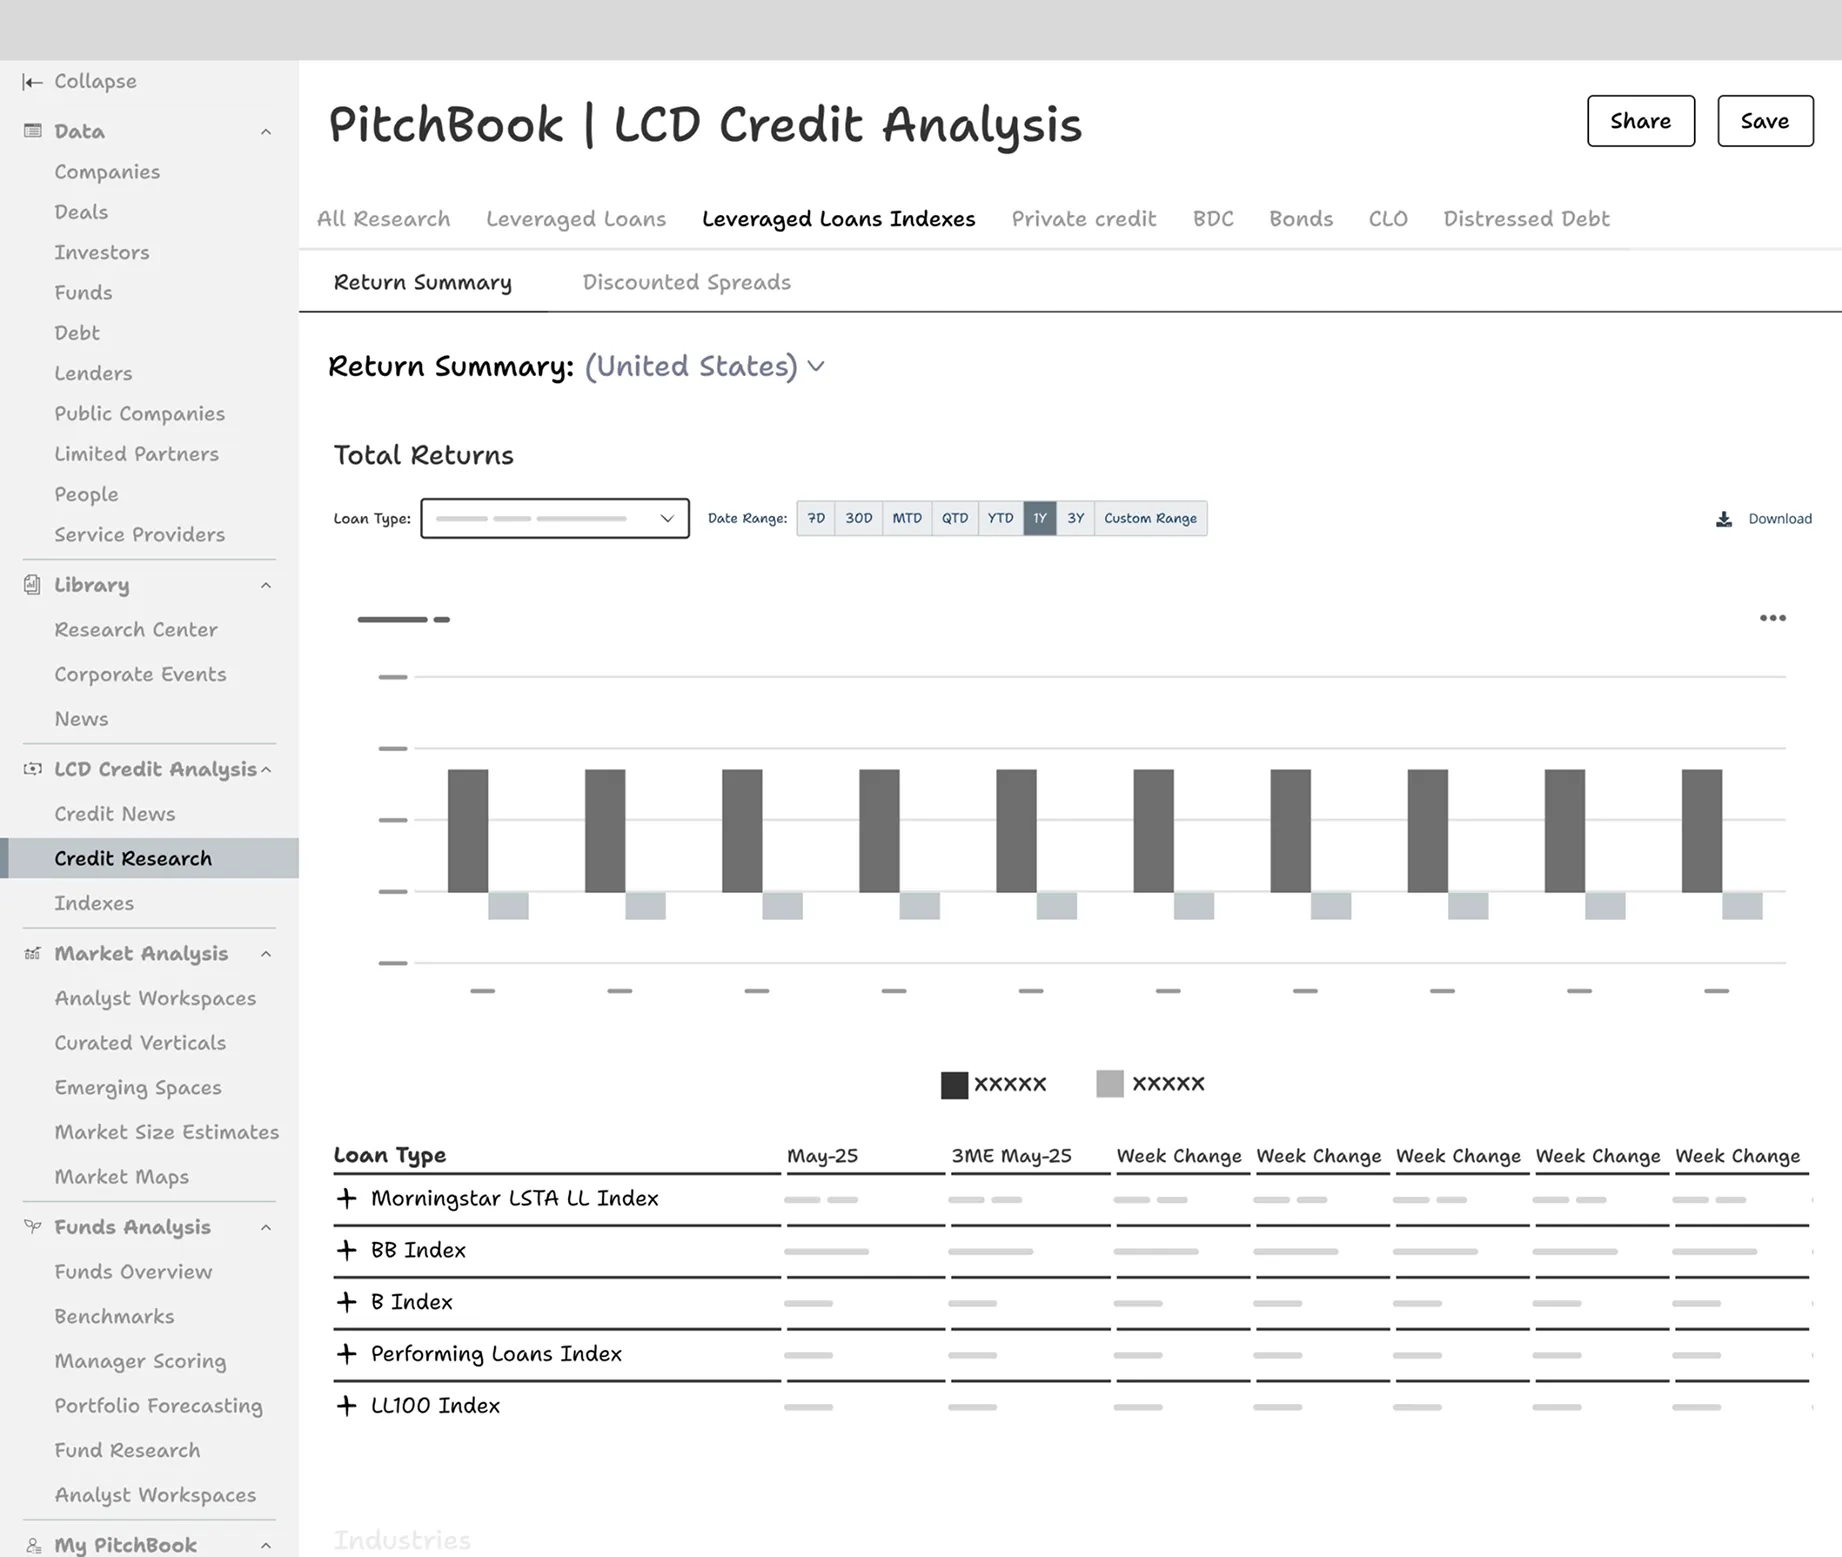
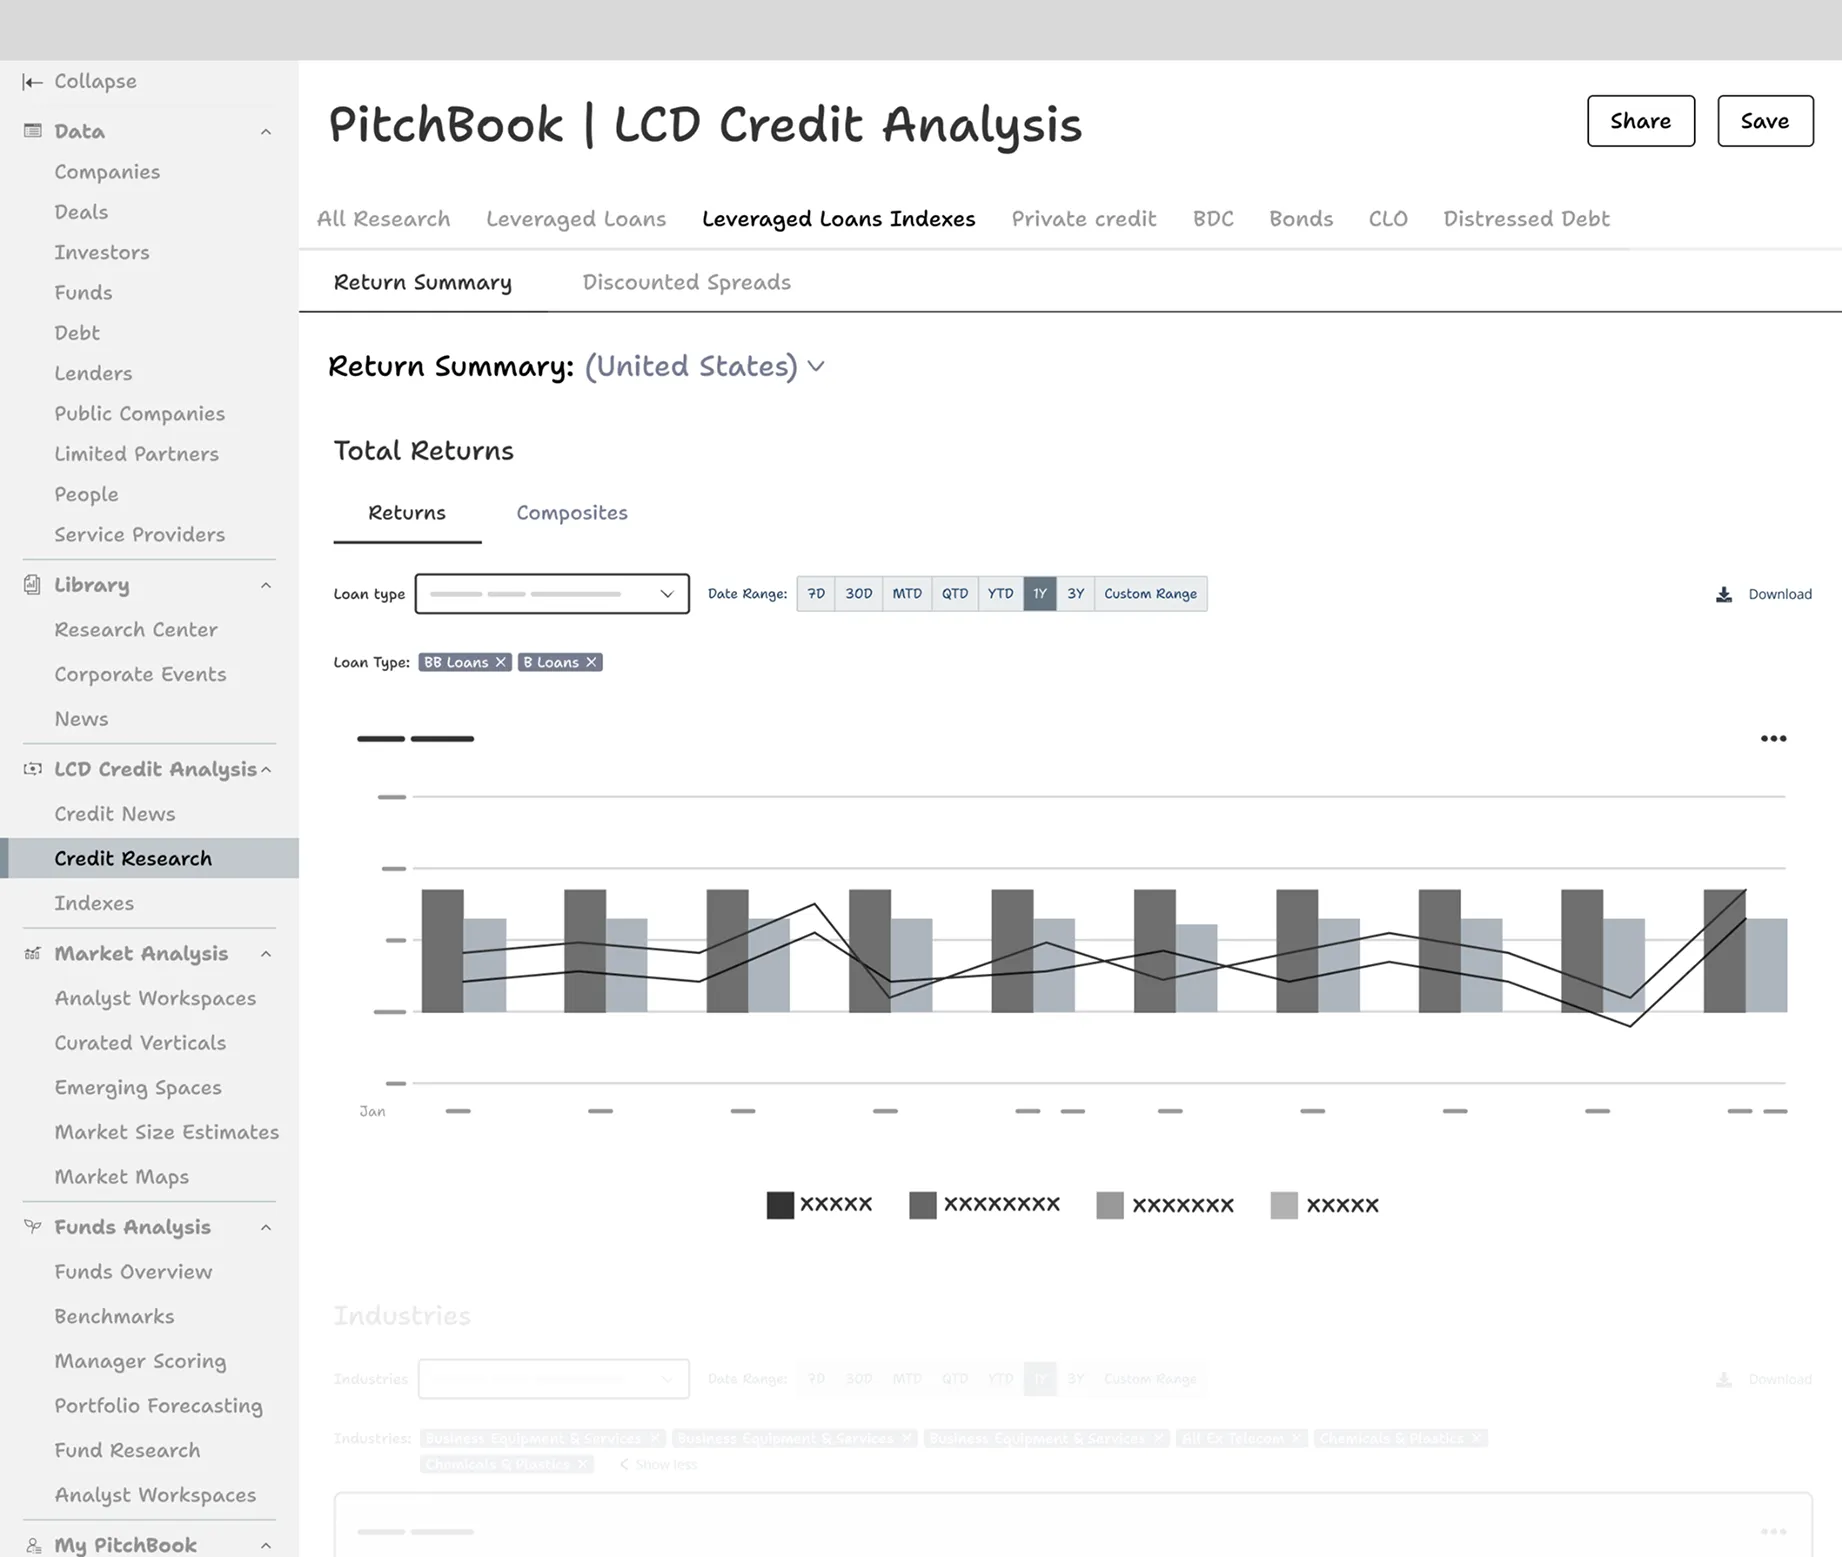
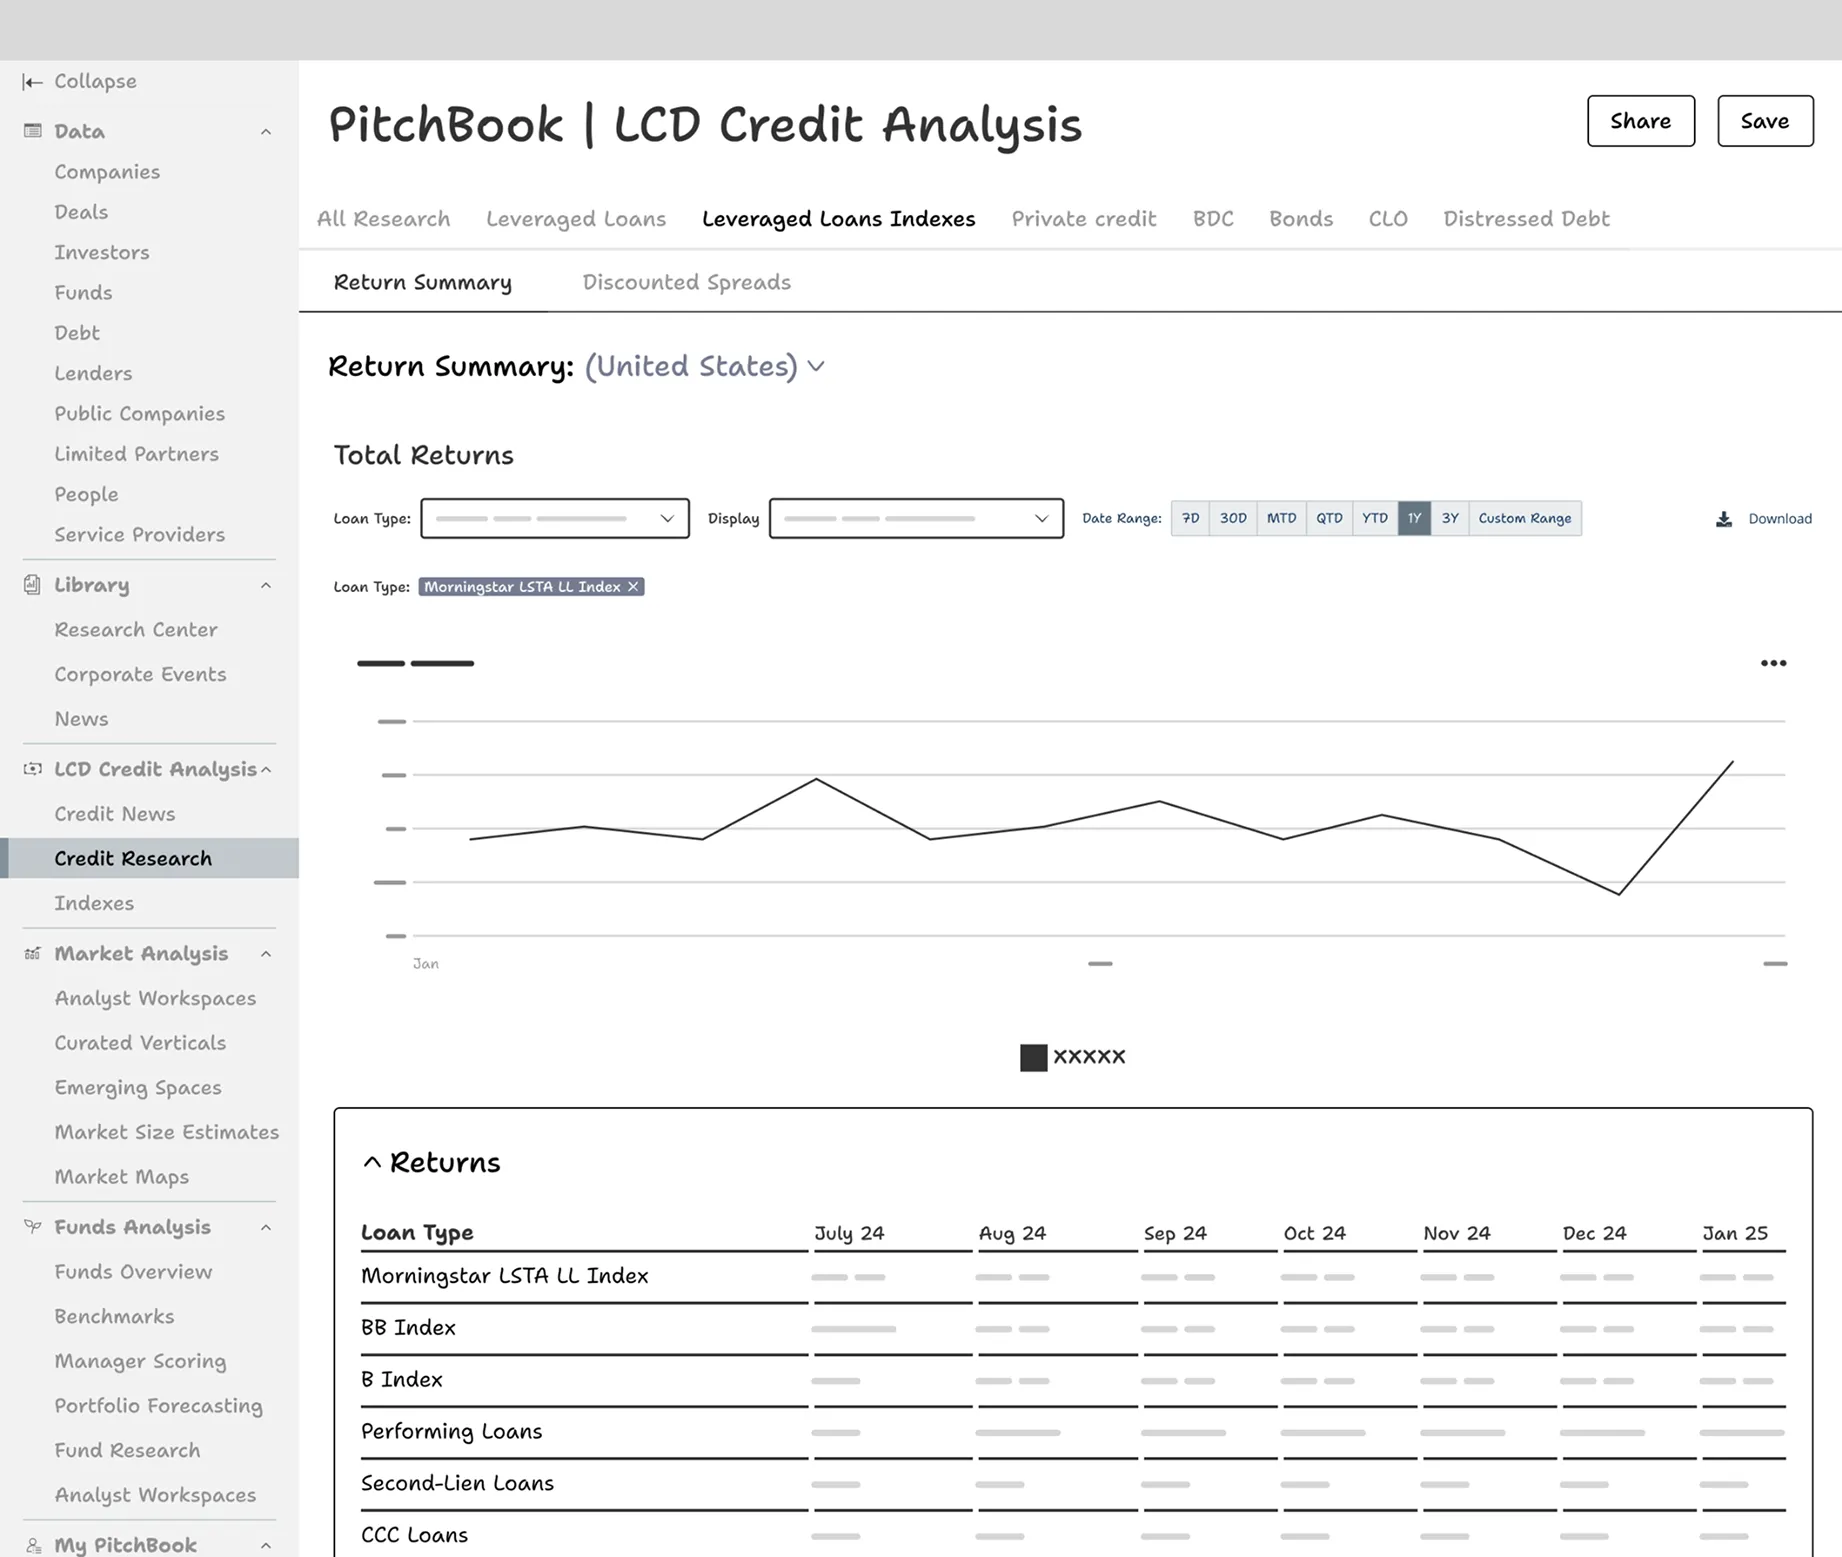
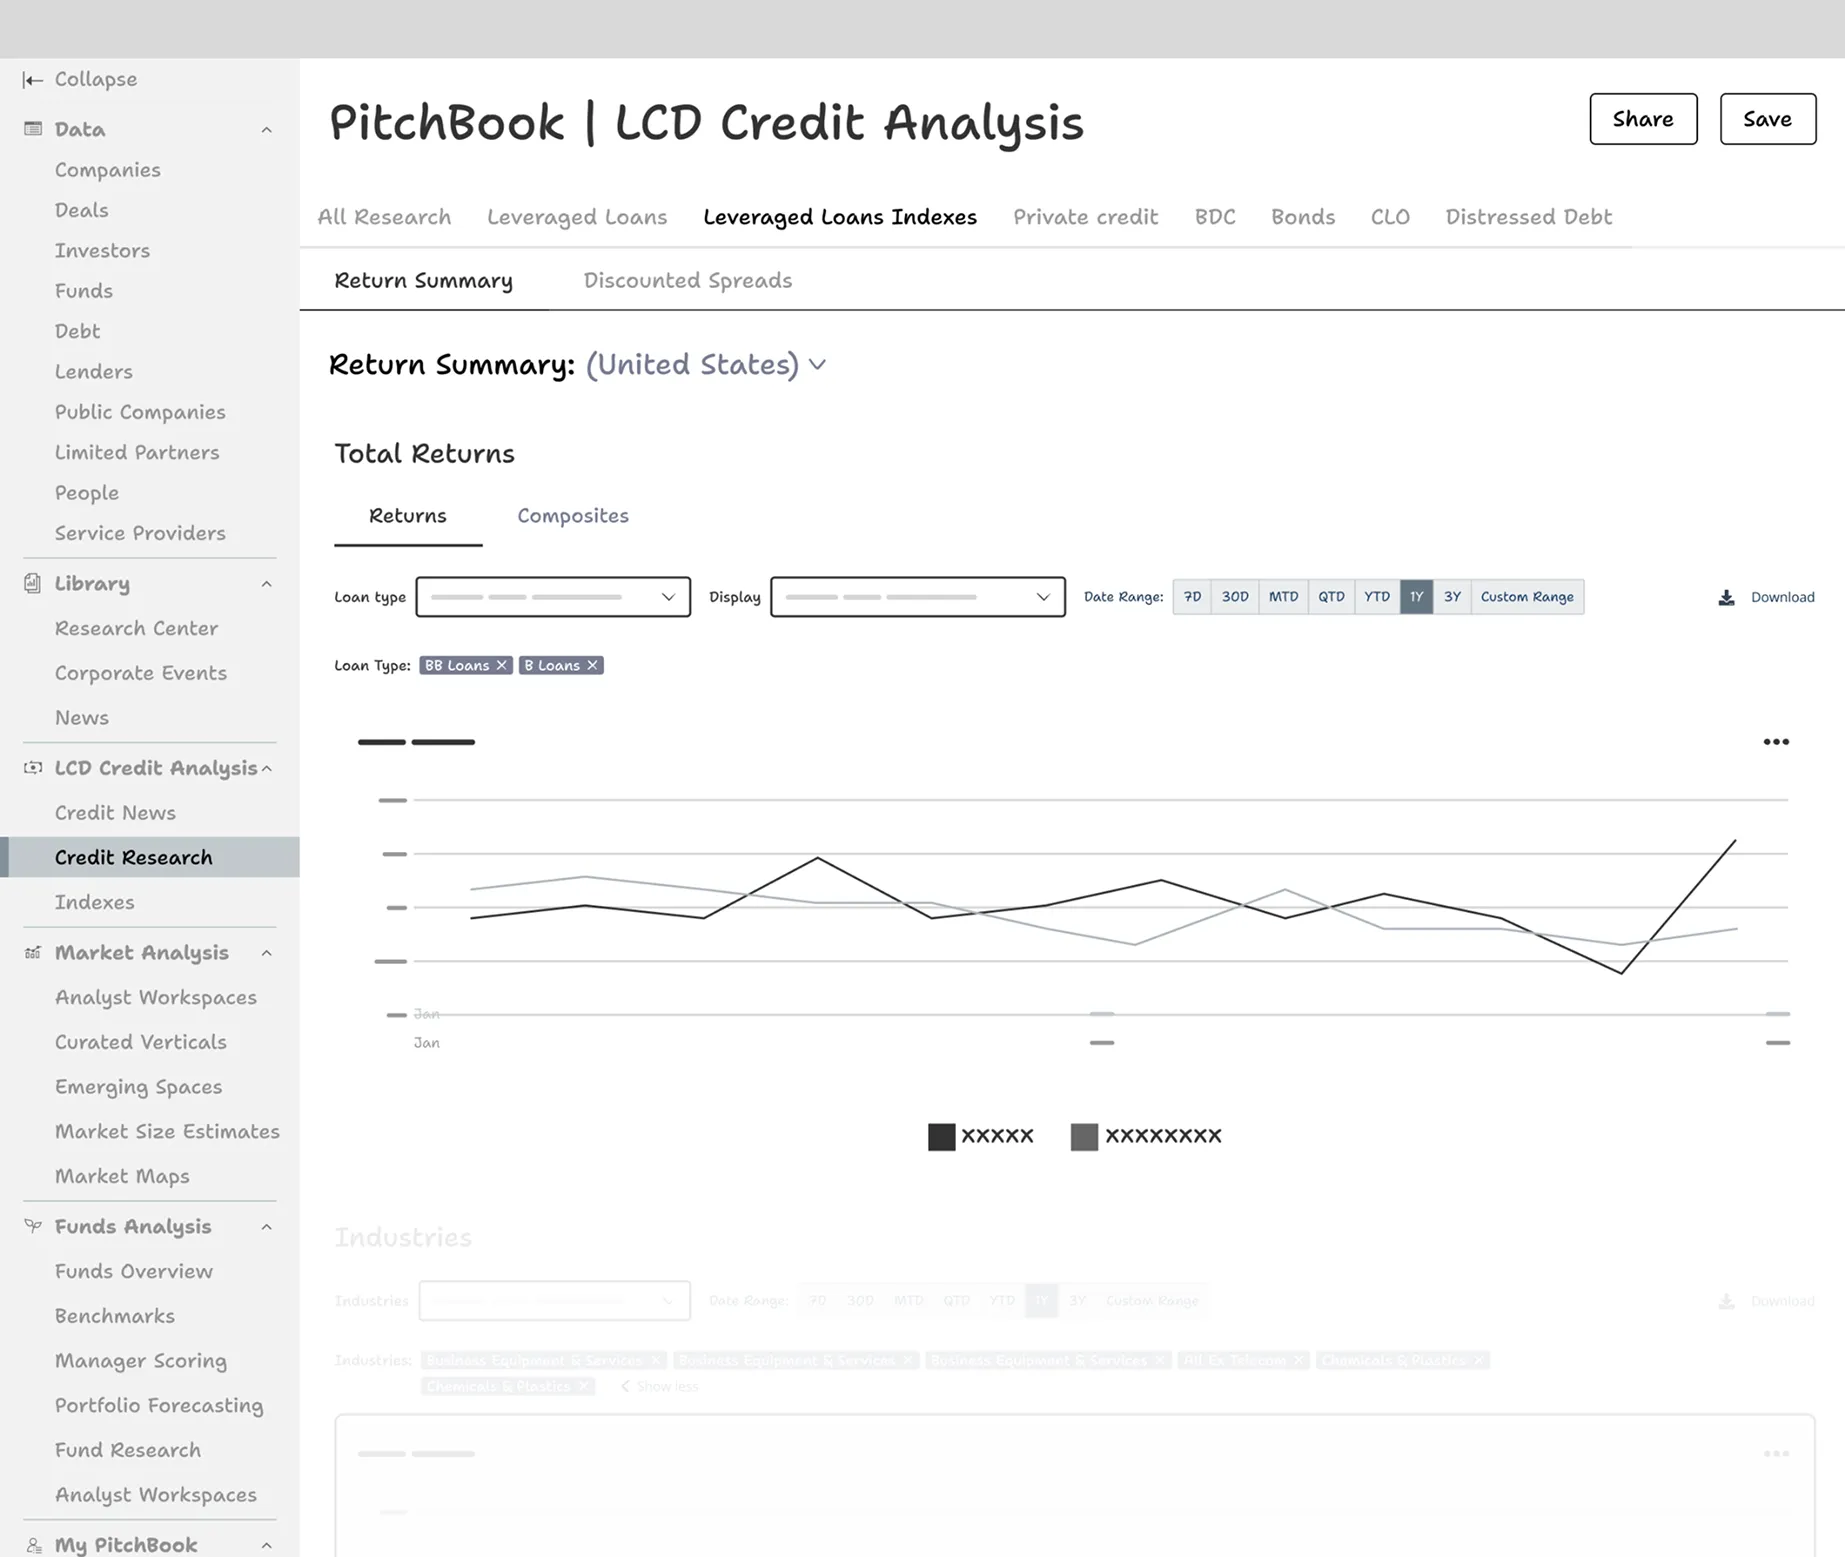
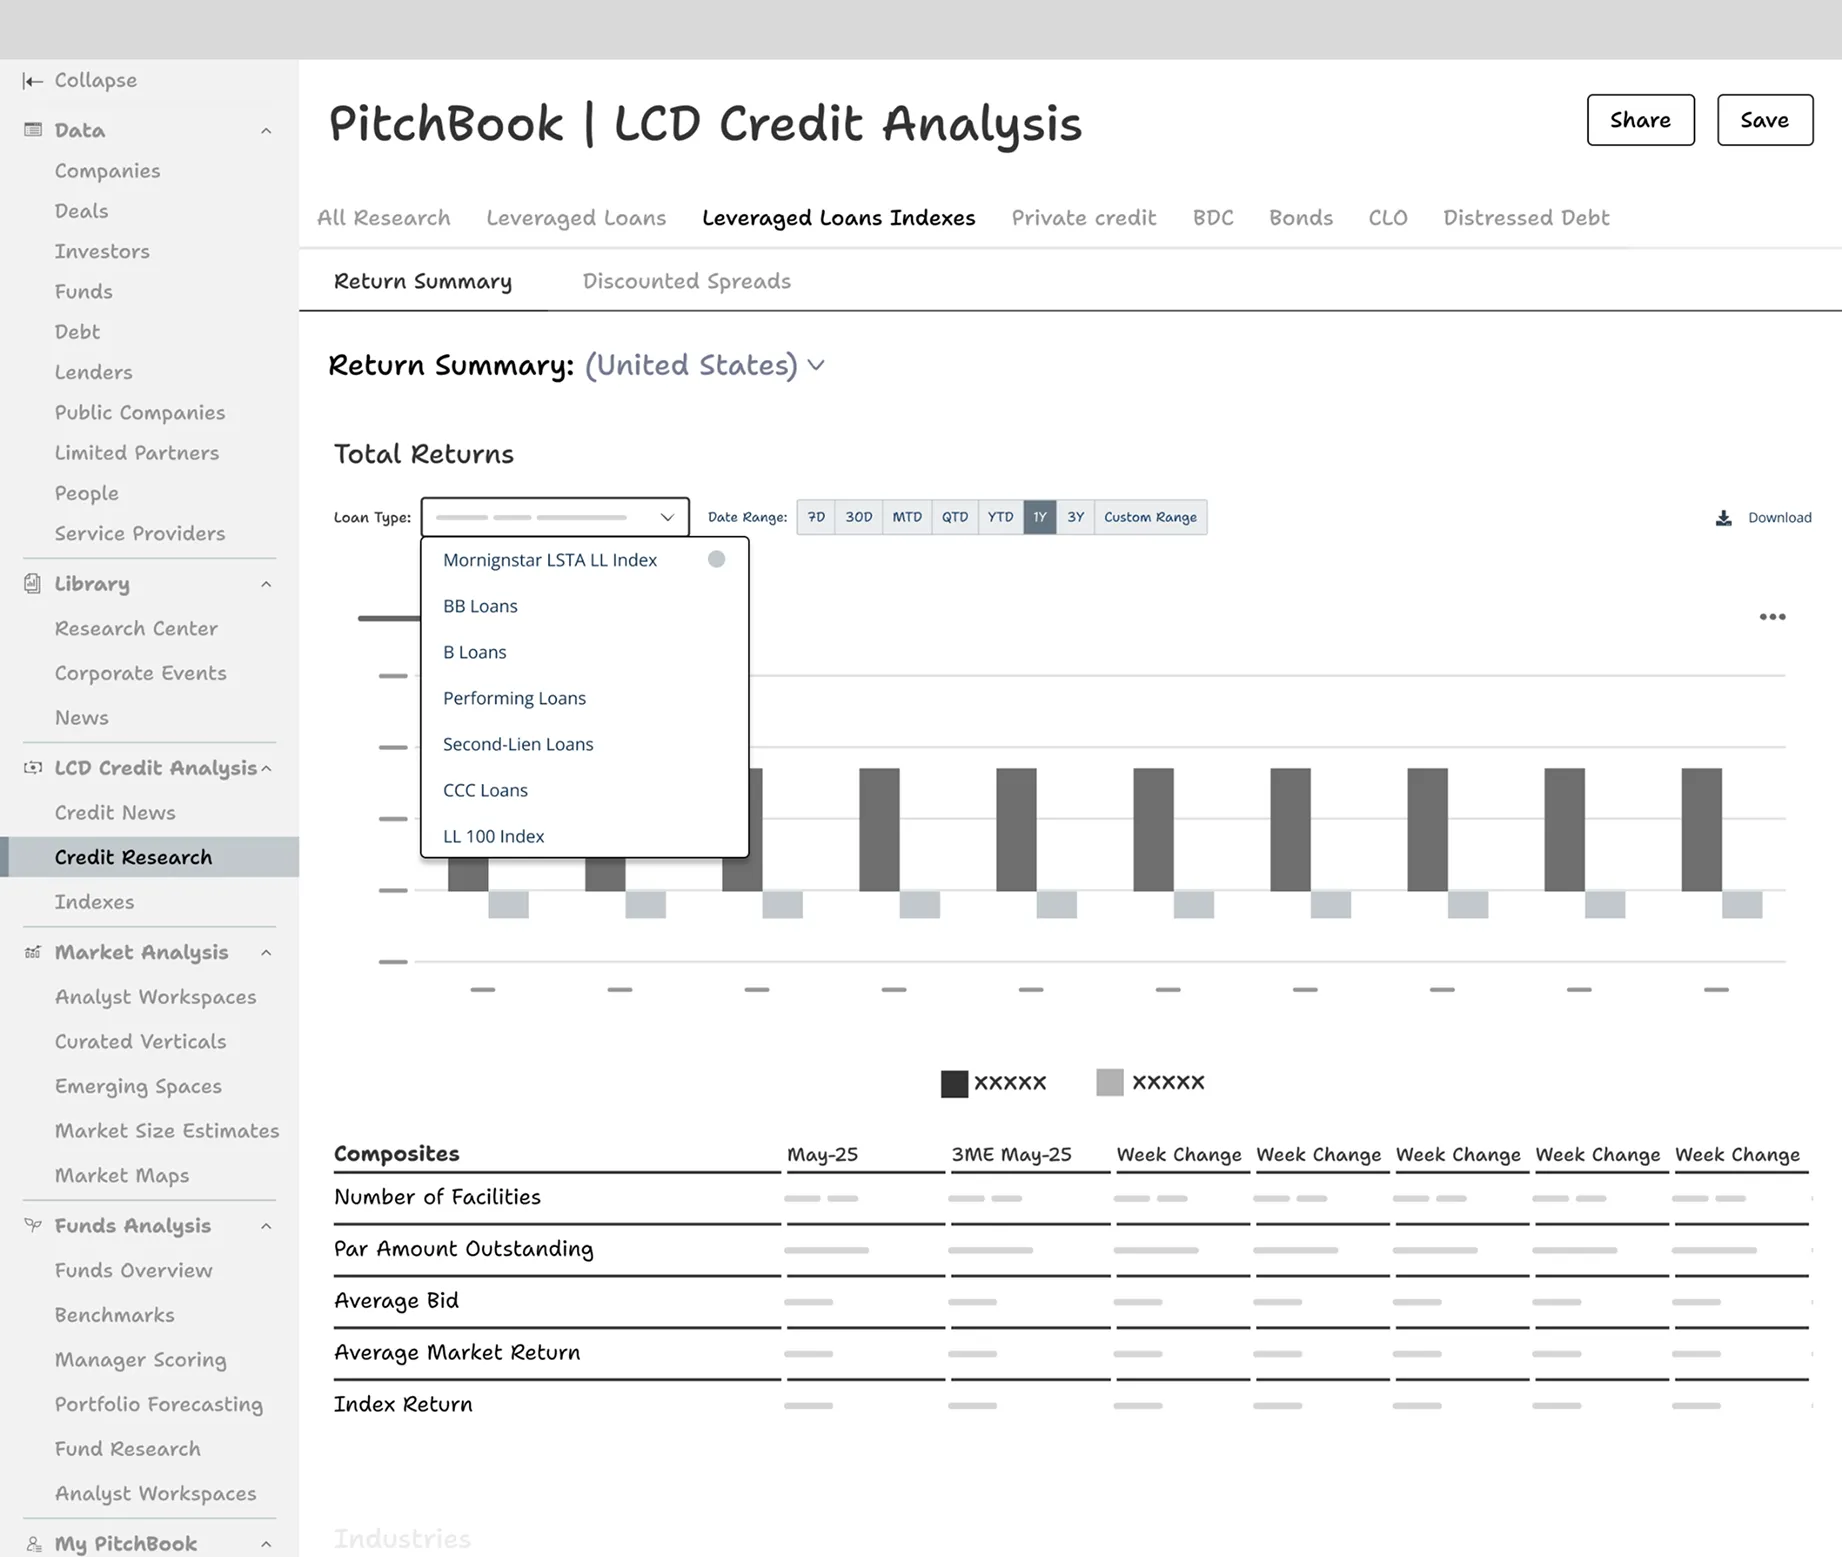
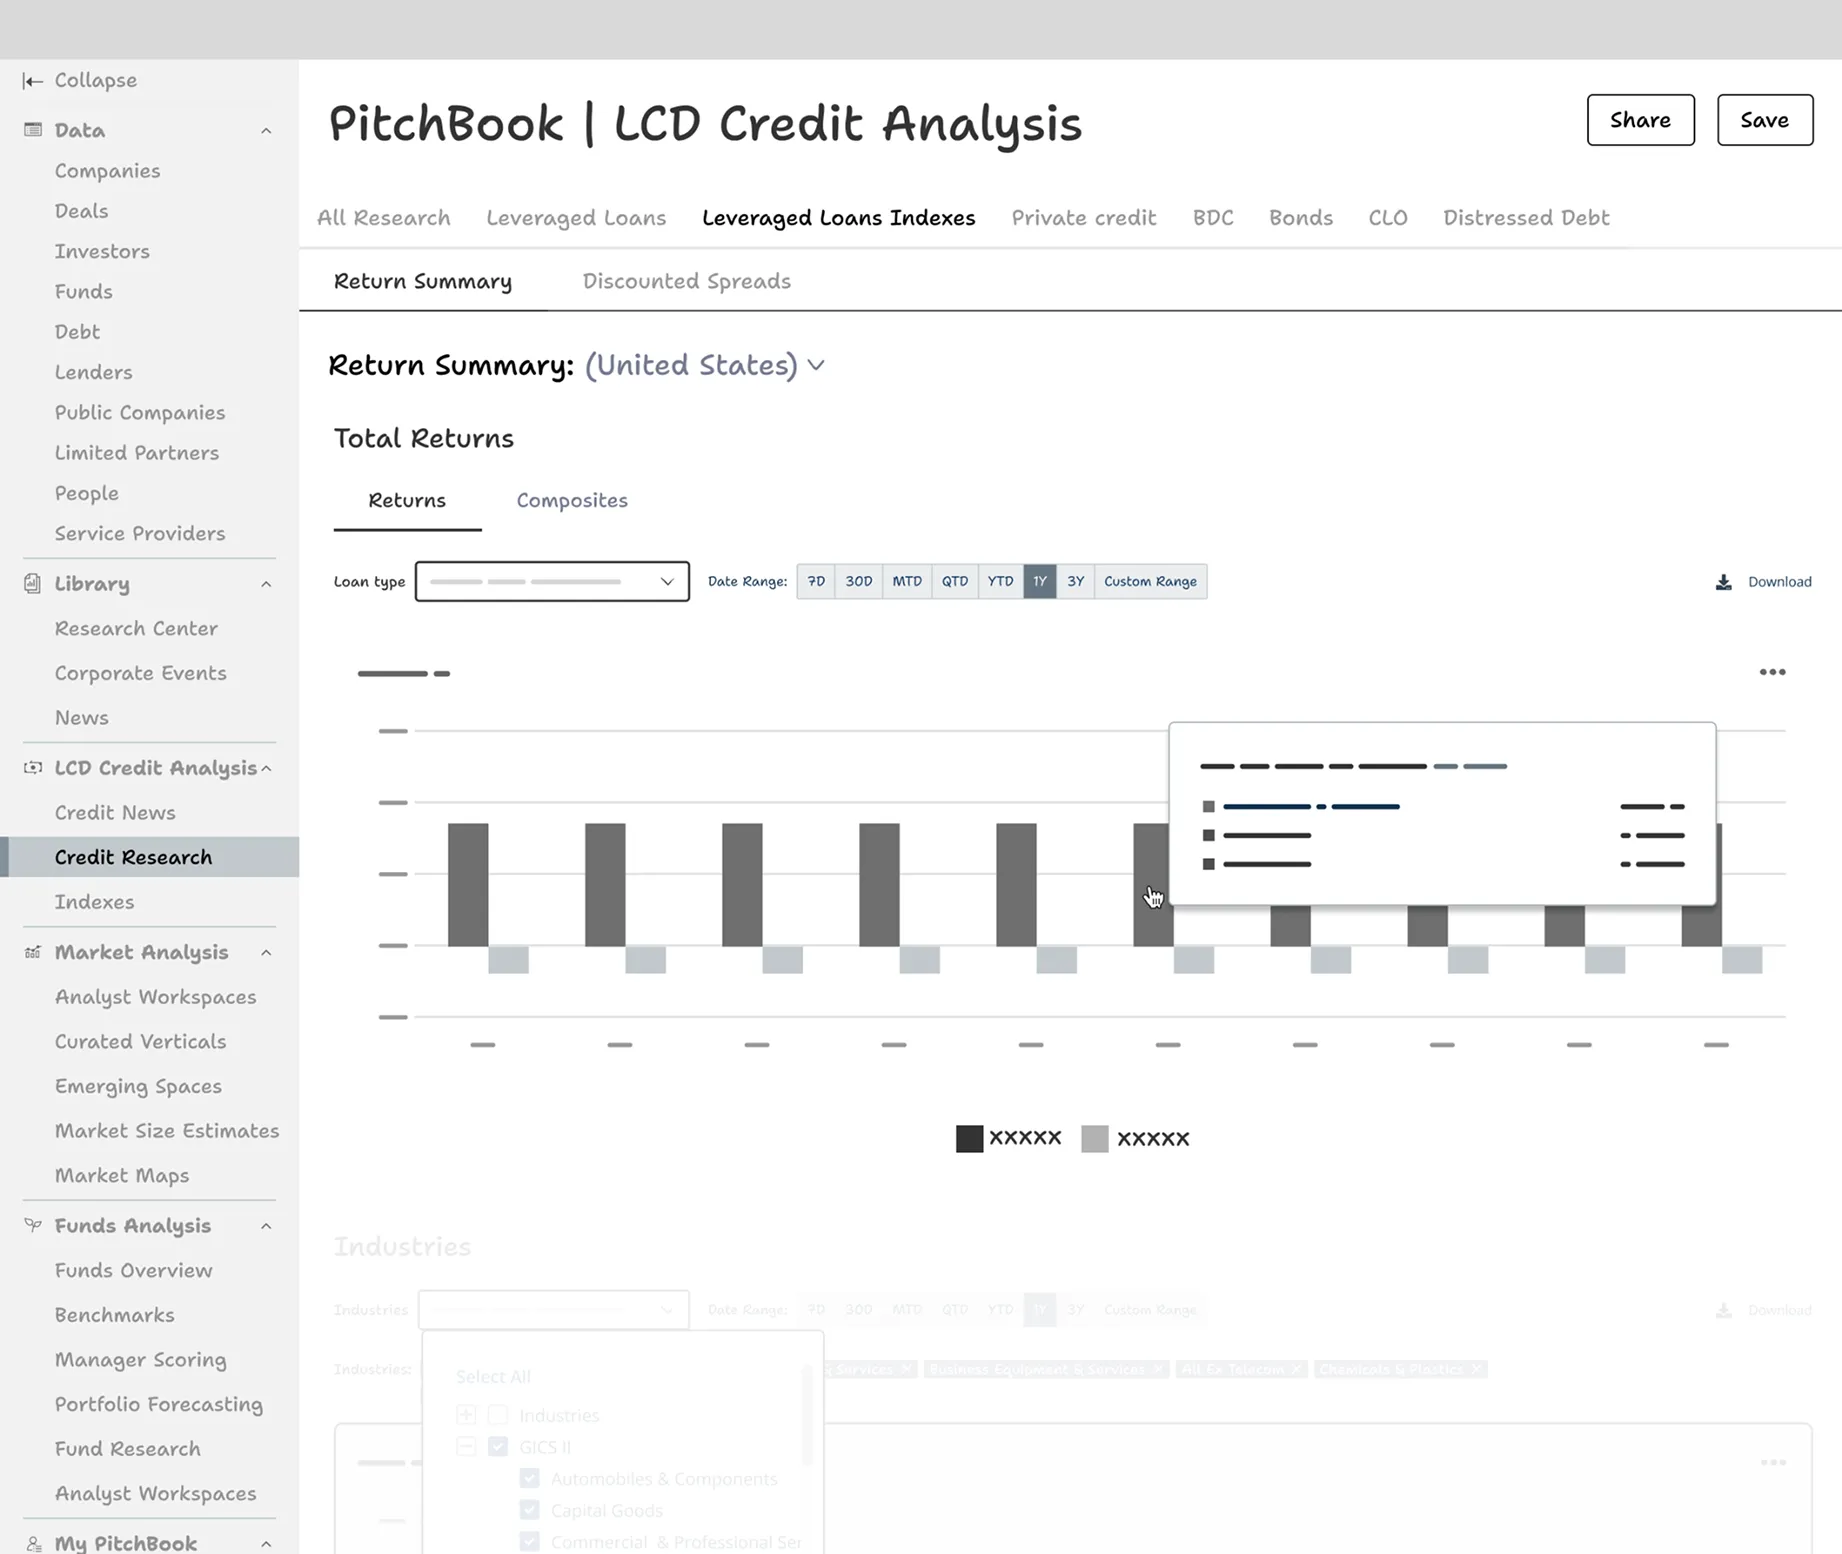
Translated the user findings and needs into features through lo-fi prototypes and tested them with the research and solutions team to get feedback on the user flows and key features without distracting them with visuals.
Challenges
Creating alignment and setting the expectations.
Showing different layers of data in a fixed chart.
Based on long-standing reports, the team was accustomed to a specific chart style and wanted it replicated on the platform, even though another format would have been more effective. This preference limited the amount of data we could display
Scoping and re-scoping to manage expectations.
Managing stakeholder excitement and multiple requests required a collaborative approach. I worked closely with the product manager and the team to prioritize needs, define the roadmap for the minimum viable product (MVP), and ensure we could move the project forward within the given timeline.
Solution
Analytics workspace for 80K+ Leveraged Loan data points.